How SolarDime calculates payback
Last reviewed · reviewed by SolarDime editorial
SolarDime produces a directional estimate, not a quote. It is built to answer "is this worth pursuing?" in sixty seconds from two facts you already know. It is not built to tell you what you will pay, and this page is the honest account of the difference.
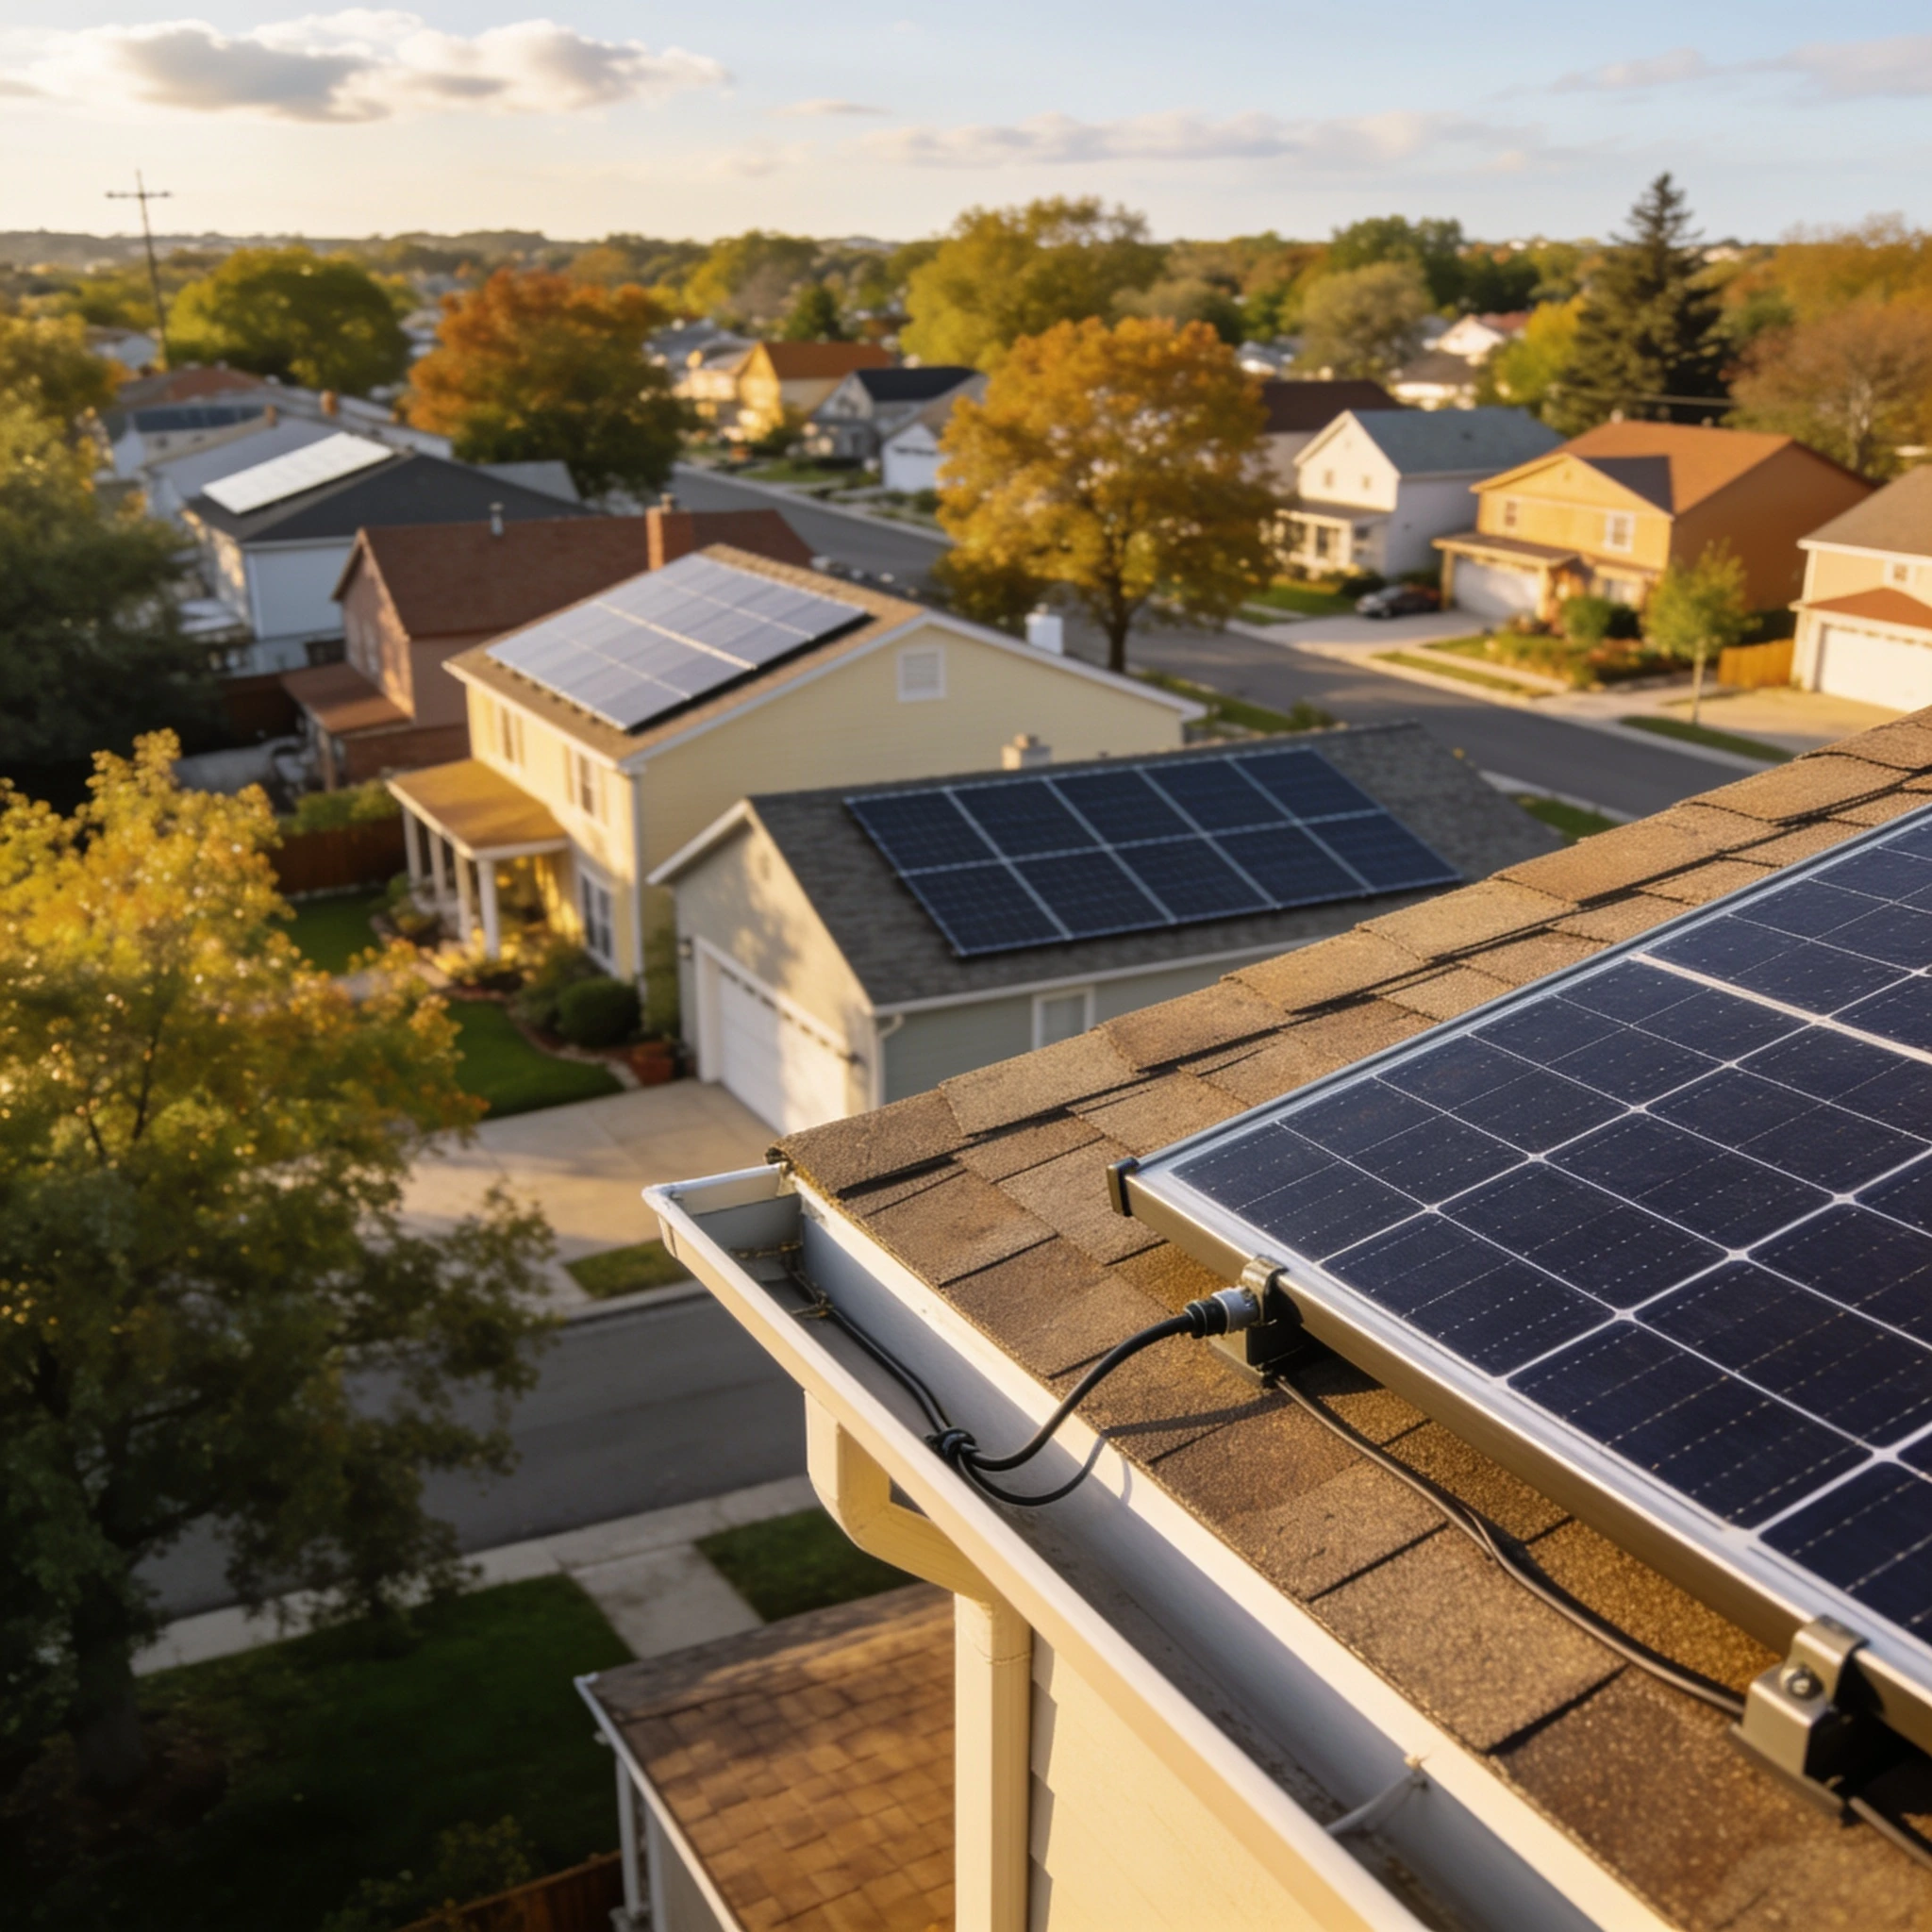
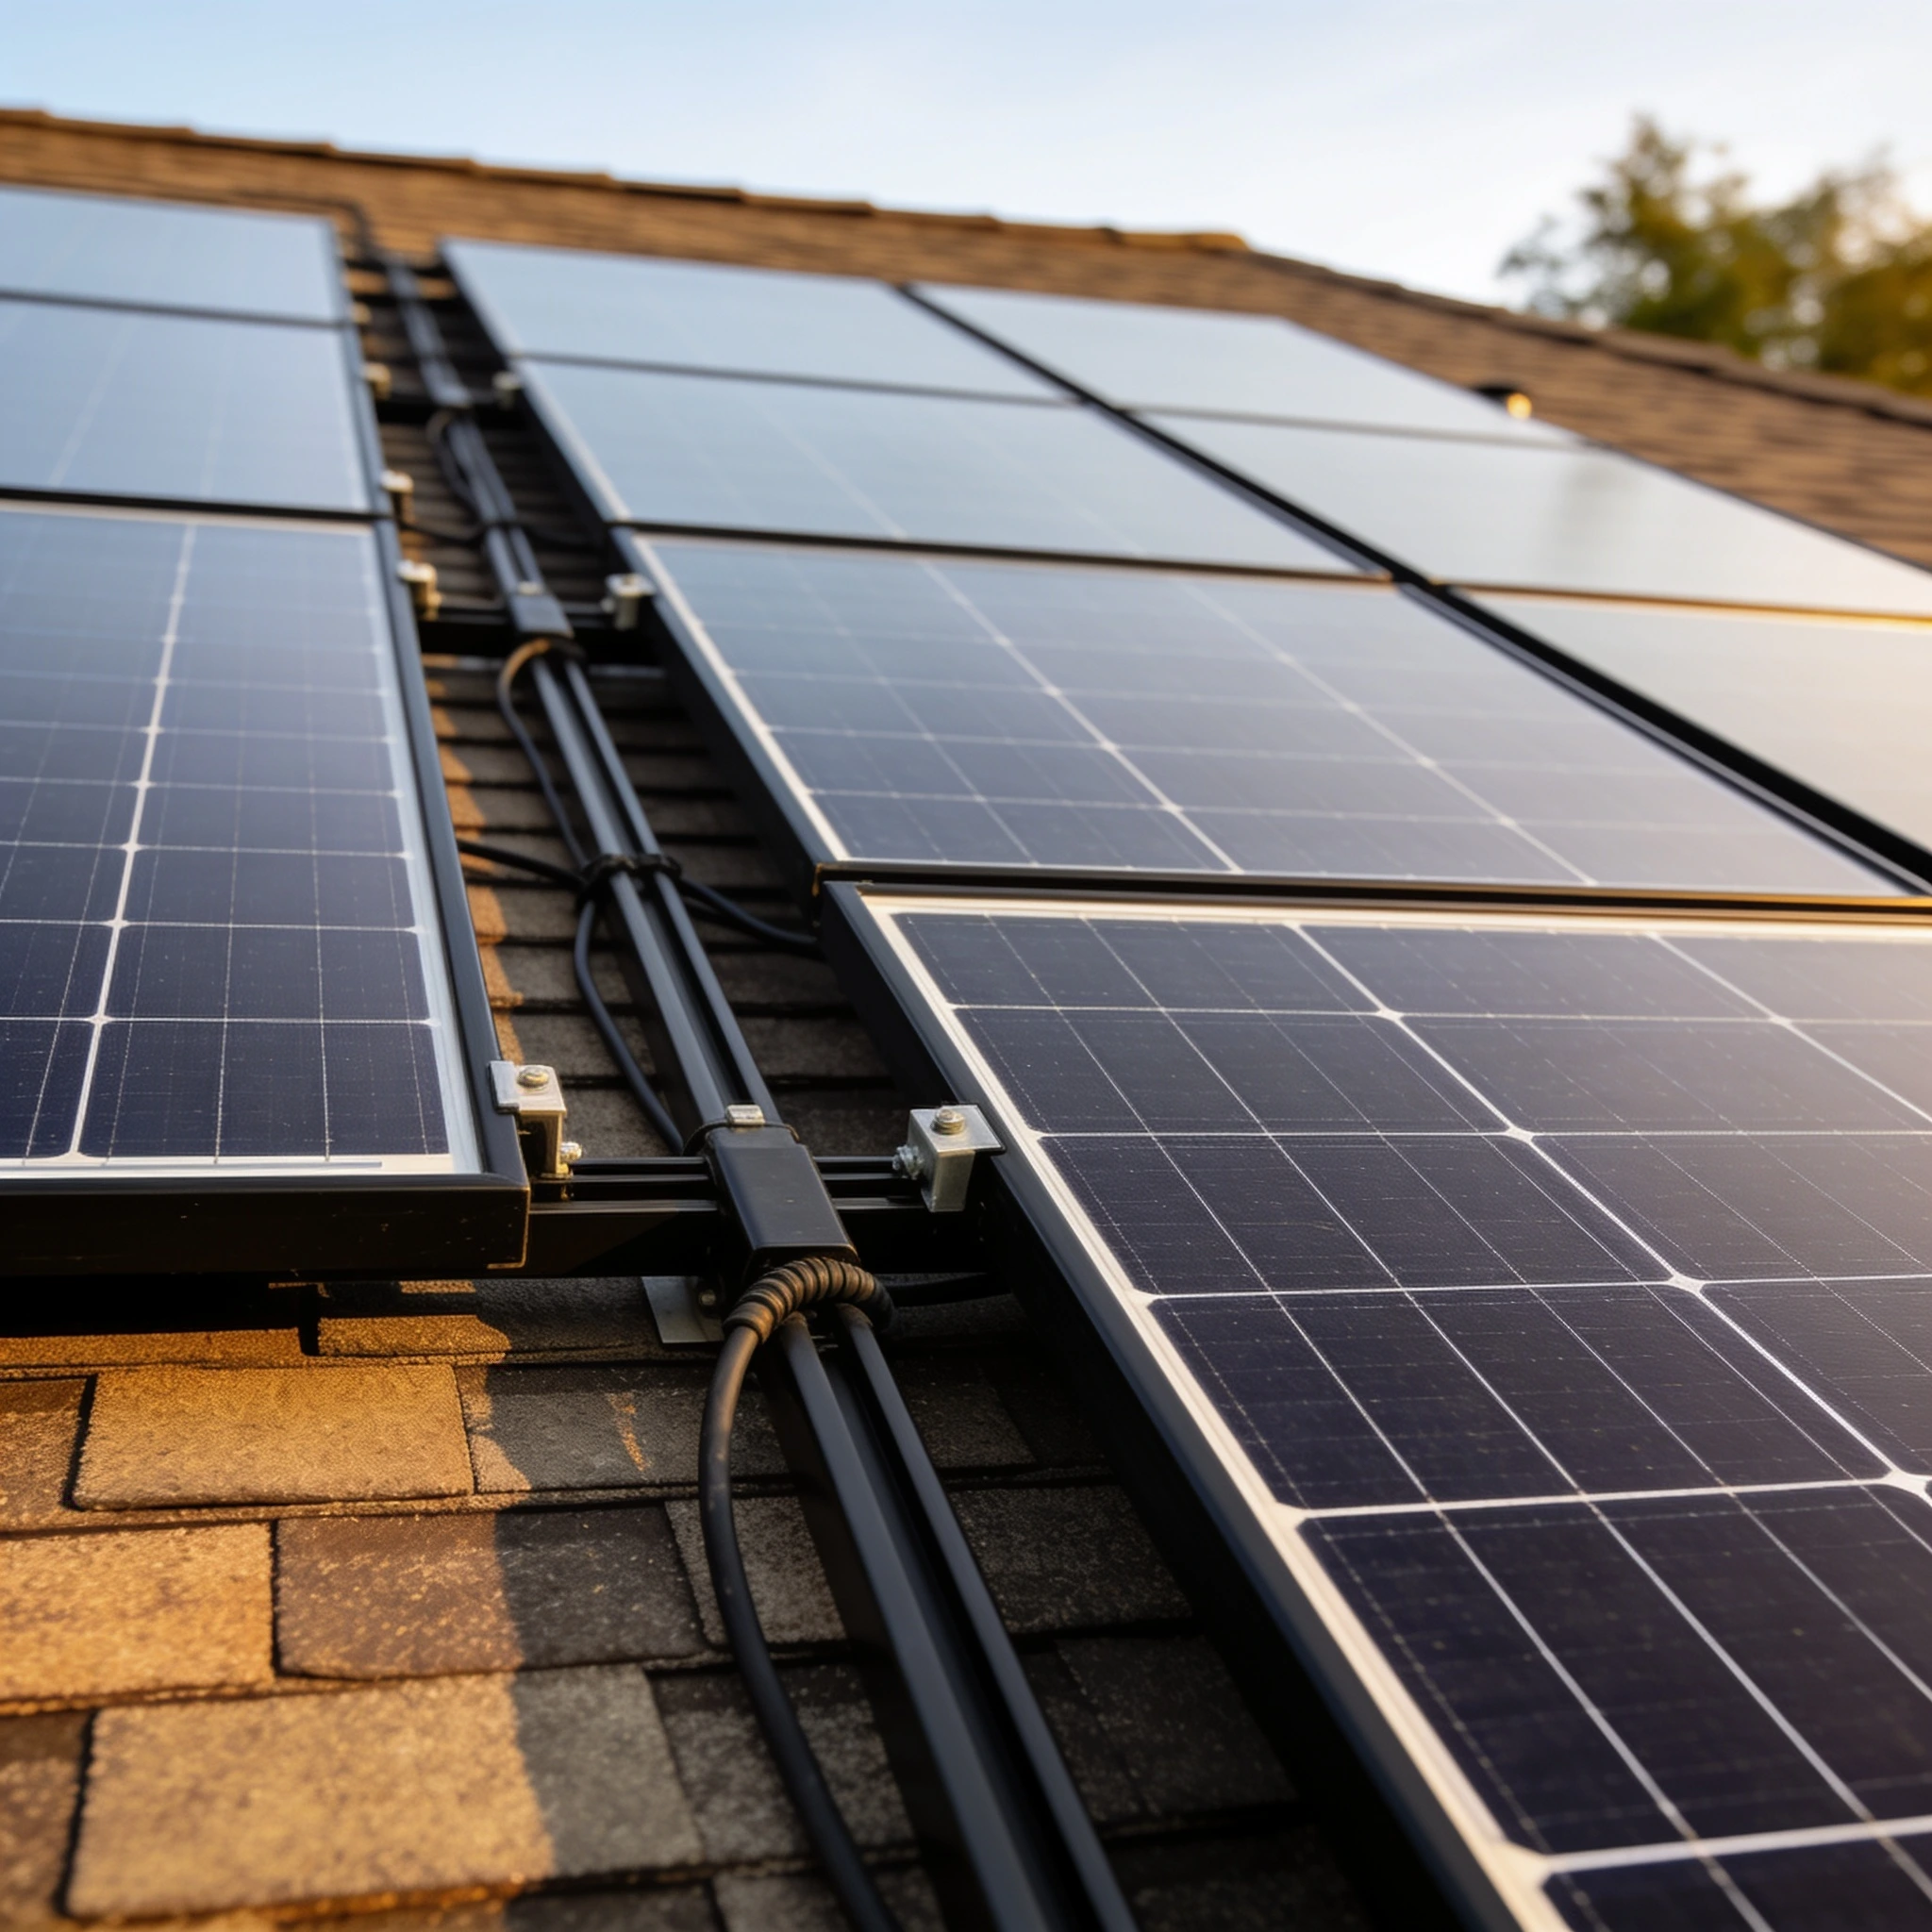
Solar at home: a visual introduction


The formula, in full
Every figure on the site comes out of these six steps. Nothing is hidden, and every input is editable on the calculator itself.
- Annual usage.
annual kWh = (monthly bill × 12) ÷ electricity rate. Your bill is the only thing we ask for, because it is the one number every household can find without research. - System size.
kW = (annual kWh × offset target) ÷ (peak sun hours × 365 × performance ratio). The performance ratio is fixed at 0.8 — a standard real-world derate covering inverter losses, wiring, soiling, heat and mismatch. - Gross cost.
gross = kW × 1,000 × installed cost per watt, defaulting to $3.00/W before any incentive. - Net cost.
net = gross − federal credit − state/local incentive. The federal credit is currently zero — see below — so unless you enter a state or utility incentive, net cost equals gross cost. - Payback.
payback years = net cost ÷ first-year savings, where first-year savings is the value of the power you offset, capped at what you actually spend. You cannot save more than your bill. - 25-year net. Savings are compounded forward for 25 years, rising with an assumed 3% annual electricity price increase and falling with 0.5% annual panel degradation, then net cost is subtracted.
Where each input comes from
| Input | Source | Vintage | Reviewed |
|---|---|---|---|
| Electricity rate ($/kWh) | U.S. EIA — Electric Power Monthly, Table 5.6.A (average residential price by state) | 2026 state averages | |
| Peak sun hours | NREL — PVWatts / National Solar Radiation Database (annual average daily solar resource) | 2026 state averages | |
| Federal tax treatment | IRS — Residential Clean Energy Credit (IRC §25D) | Credit ended for installations completed after 31 Dec 2025 (P.L. 119-21) | |
| Installed cost ($/W) | Installed cost per watt — typical residential quote range, operator estimate | 2026 estimate, user-editable |
To be exact about what "vintage" means here: the per-state sun and rate figures are hand-entered, rounded state averages taken from the datasets above and re-checked on the review date. They are not a live API feed, and they are not your utility's tariff. For your real rate, read the $/kWh line on your own bill and type it into the calculator — that single change makes the estimate materially better than any state average can.
The federal credit, and why it is zero
The Residential Clean Energy Credit (IRC §25D) returned 30% of a system's cost. The One Big Beautiful Bill Act (P.L. 119-21) ended it for expenditures made after 31 December 2025, and for this credit an expenditure counts as made when the original installation is completed — so a system switched on in 2026 receives nothing federal even if it was paid for in 2025. SolarDime therefore subtracts no federal credit. The longer explanation is here.
This estimate does not determine tax eligibility, tax liability or carryforward value. Confirm Form 5695 treatment with the IRS or a qualified tax professional.
What the model deliberately excludes
These are real costs and real revenues that a quote will contain and this estimate will not. None of them is an oversight; each is a variable the site cannot know from a bill and a state.
- Utility structure — fixed monthly charges, time-of-use pricing, demand charges, minimum bills.
- Export compensation — whether power you send back is credited at full retail, at an avoided-cost rate, or on a monthly rather than annual netting period.
- Financing — loan interest, dealer fees, lease and PPA escalators. A 25-year loan changes payback more than most siting decisions.
- Storage — battery cost, and the extra value of self-consumption where exports are credited below retail.
- The roof — orientation, pitch, shade, usable area, age, and any re-roofing needed first.
- Ongoing costs — maintenance, inverter replacement, insurance, cleaning.
- Quote dispersion — quotes for the same roof routinely differ by thousands of dollars.
Glossary
- kWh (kilowatt-hour)
- The unit your bill is measured in — one kilowatt drawn for one hour. A typical US home uses somewhere between 6,000 and 15,000 kWh a year.
- kW (kilowatt)
- System size, not energy: the peak output of the array under standard test conditions. A 7 kW system is roughly 16–20 modern panels.
- Peak sun hours
- Daily solar resource expressed as the number of hours at 1,000 W/m² that would deliver the same energy. Arizona sits near 6.5; Washington near 3.5. It is not hours of daylight.
- Performance ratio
- The fraction of theoretical output a real array delivers after inverter losses, heat, wiring, soiling and mismatch. We use 0.8, a conventional mid-range value.
- Degradation
- The annual decline in panel output as the modules age — 0.5% a year here, which is why a 25-year projection is not simply year one multiplied by 25.
- Installed cost per watt
- Total installed price divided by system watts — the standard way to compare quotes across different system sizes. Ask every installer for theirs.
- Export value / net metering / net billing
- What your utility pays for power you send back. Full retail net metering credits it at the price you buy at; net billing credits it at a lower avoided-cost rate, which is why self-consumption and batteries matter more in those states.
- SREC
- Solar Renewable Energy Certificate — a tradeable certificate some states issue per MWh generated, sold separately from the electricity itself. Where the market is strong it can shorten payback substantially.
- Incentive eligibility
- Whether a given credit or rebate actually applies to you — a function of installation date, ownership, tax liability and programme rules, none of which a calculator can determine.
The home behind the numbers
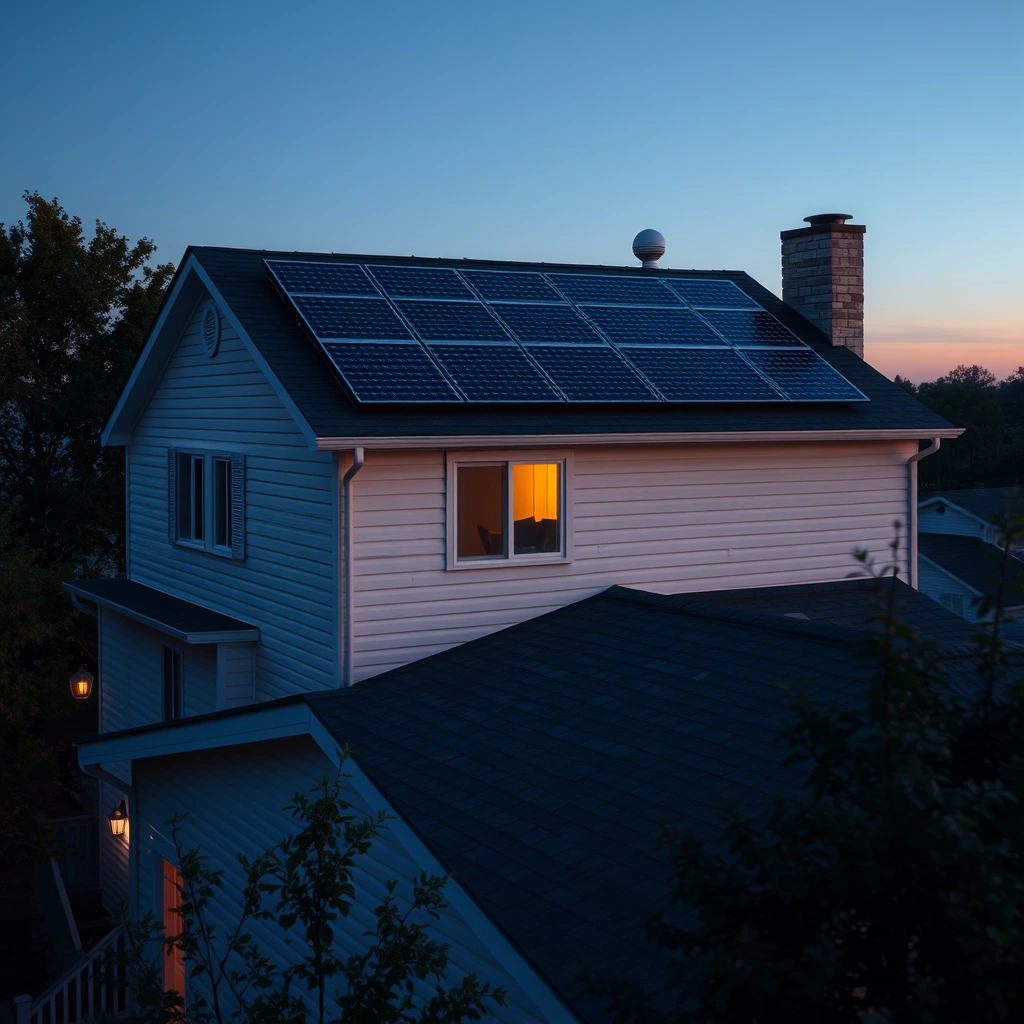
Use these illustrative views alongside the assumptions above when you discuss a system with an installer.
Panels and installed cost
Compare complete installed quotes for the same system size and scope.



Sunlight and payback
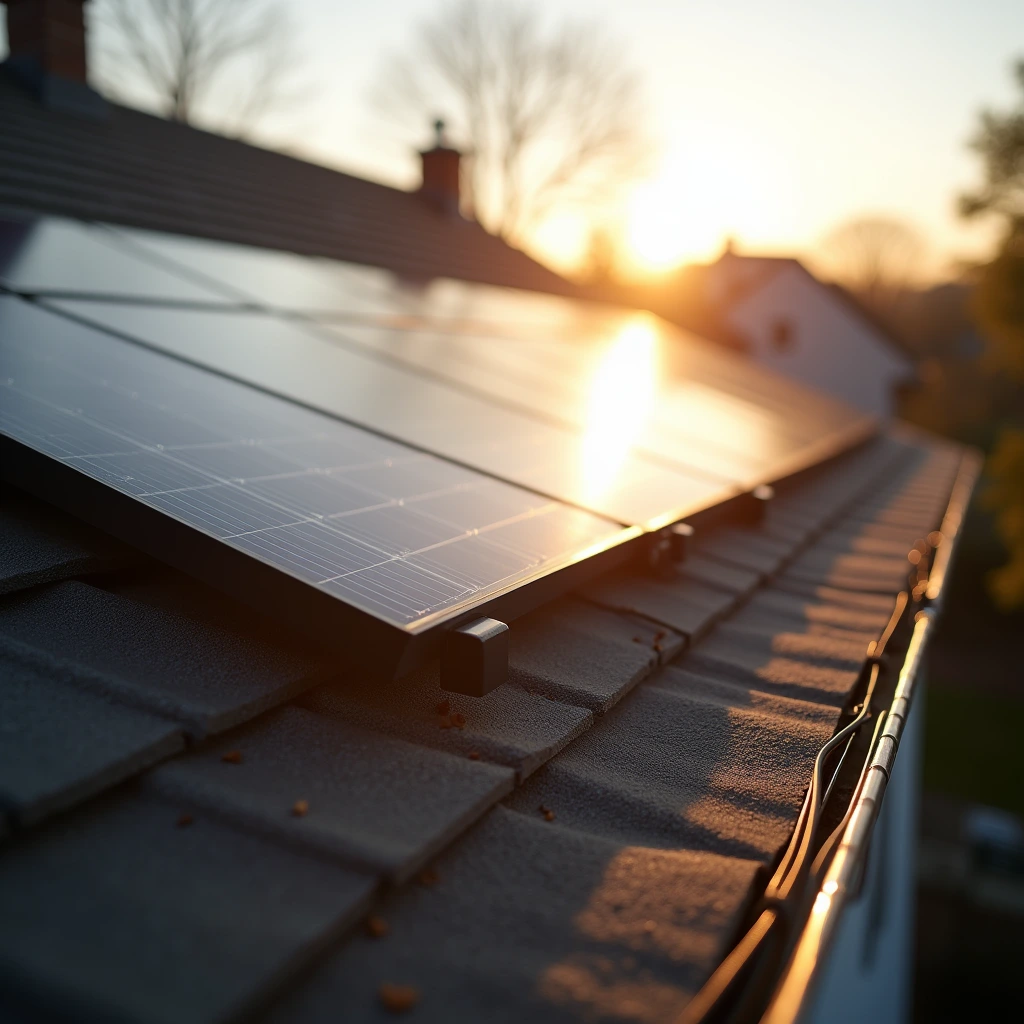
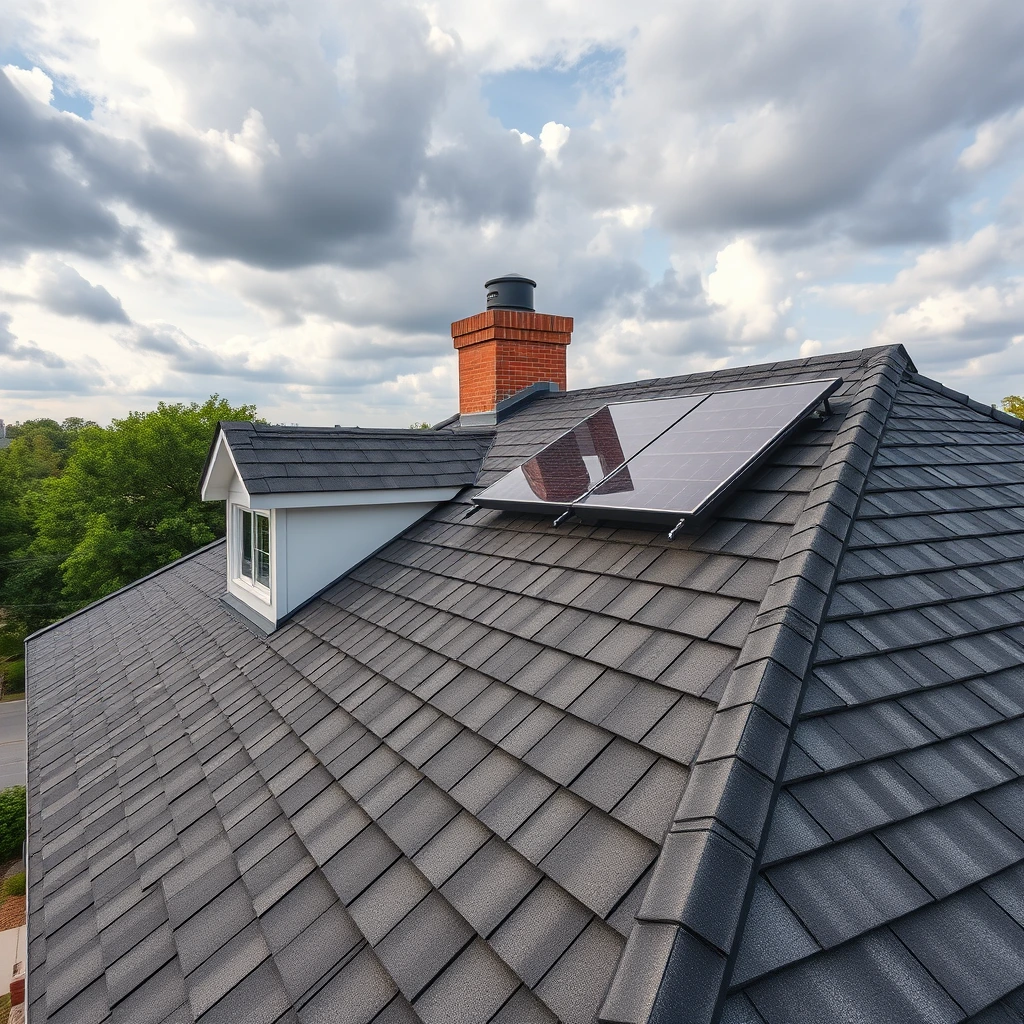
Panel exposure and electricity use are inputs to your estimate; a photograph cannot predict a specific roof’s output.

Compare the financing terms
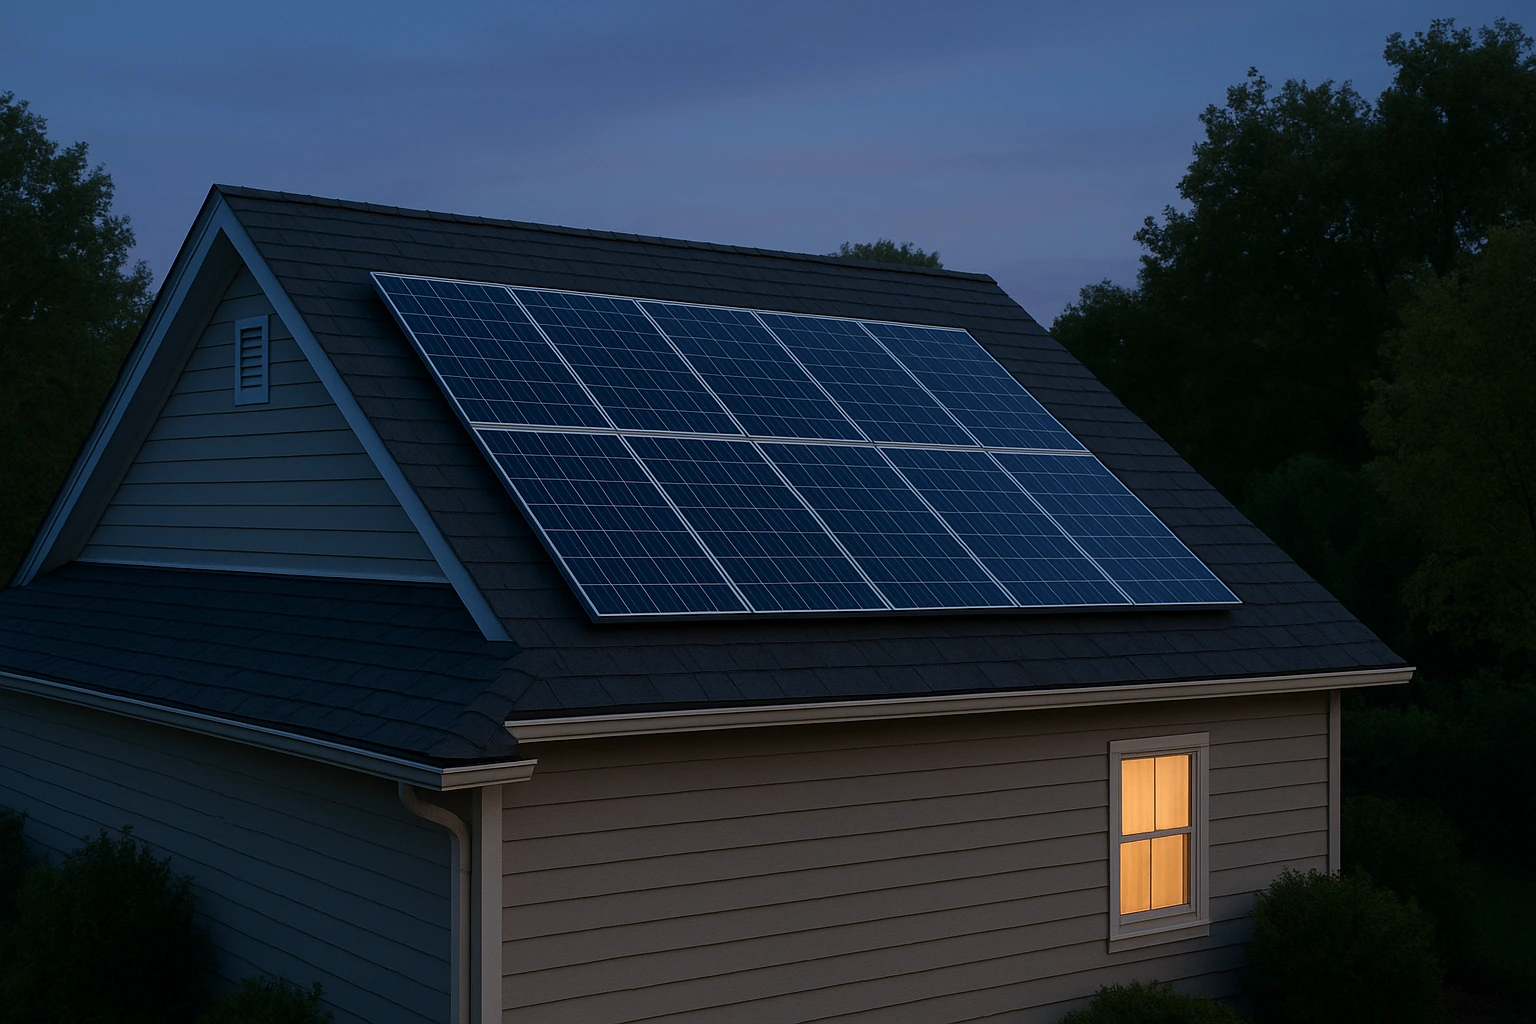
The calculator excludes financing. Check a quote’s interest, fees and payment schedule separately.




Start with the roof
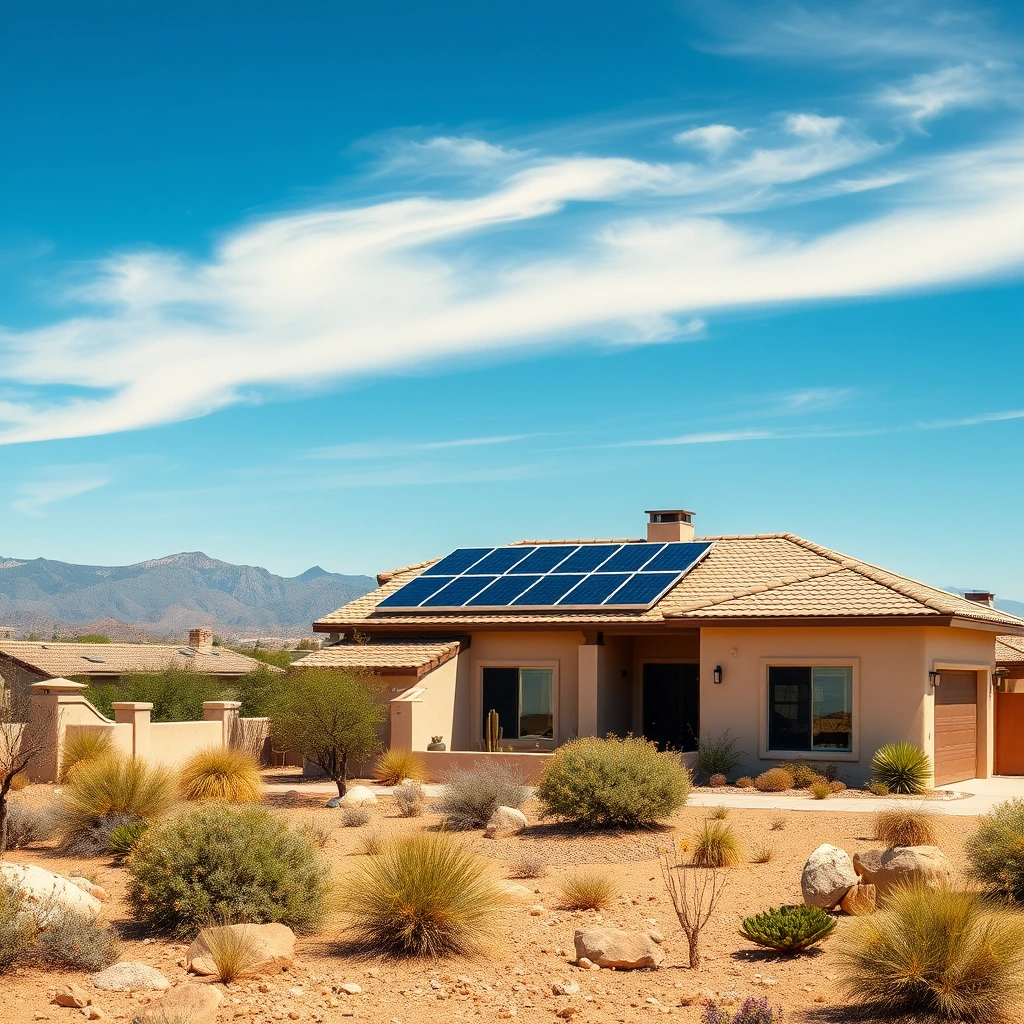
Discuss roof condition, orientation, usable area and shading before settling on a system.


How this page is kept current
The data table above carries a review date and a review owner, and scripts/check-data-freshness.mjs fails the build once that date is more than 90 days old. A second gate, scripts/check-current-law.mjs, fails the build if the federal credit rate is ever non-zero while the site still says it ended, or if any page makes an unqualified "30% federal credit" claim. Those two checks exist because an obsolete 30% credit survived on this site for months after the law changed; a review date that nobody enforces is not a control.
Data sources and assumptions
- Electricity ratesU.S. EIA · 2026 state averages
- Solar resourceNREL · 2026 state averages
- Federal tax treatmentIRS · Credit ended for installations completed after 31 Dec 2025 (P.L. 119-21)
- Installed costInstalled cost per watt · 2026 estimate, user-editable
State assumptions last reviewed: . Rules can change; verify your utility and state program before signing a contract. Full methodology.